About Engineering Analytics
Engineering Analytics turns everyday development activity — commits, pull requests, work items, pipelines, deployments, and IDE AI usage — into leadership-ready dashboards, daily AI insights, Your Story narratives, and scheduled reports. Connect once, then explore fast, always-available analytics without hammering your Azure or GitHub APIs.
Visibility for engineering leaders, built on data you already have
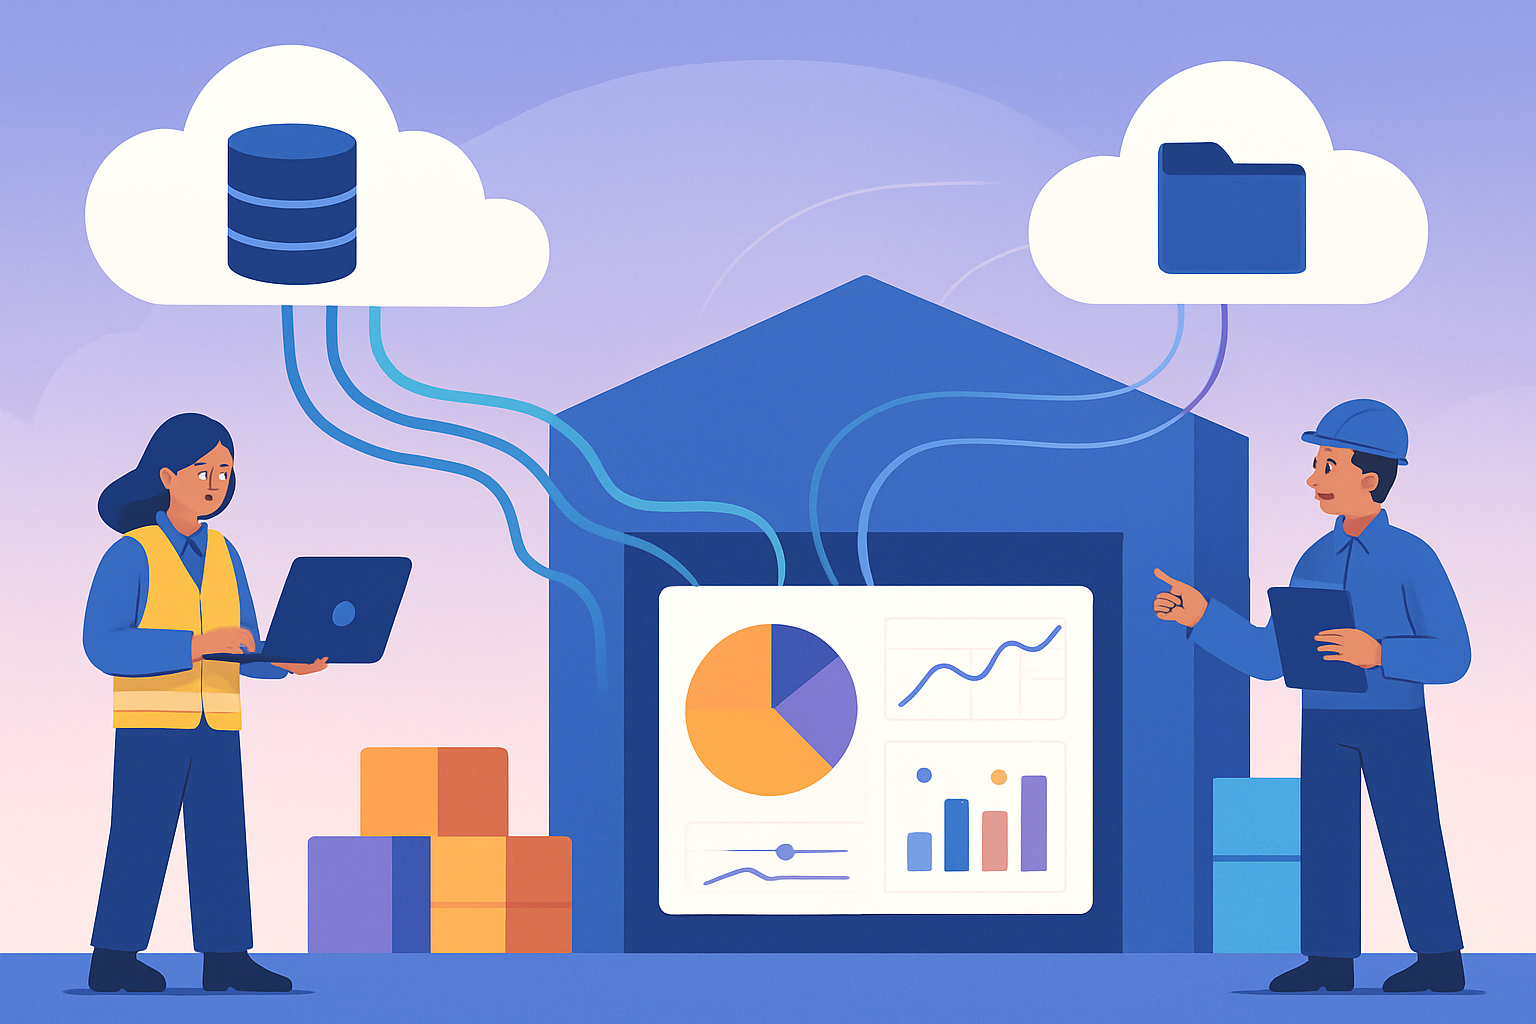
Engineering Analytics is a multi-tenant platform that helps engineering leaders measure delivery activity across teams, vendors, repositories, CI/CD pipelines, and IDE AI tools. It is designed for visibility, collaboration, and process health — not employee surveillance or individual productivity scoring. Administrators map developers to teams and vendors and manage bot detection, so reporting reflects the analytics you actually care about.
Everything you need to measure engineering activity
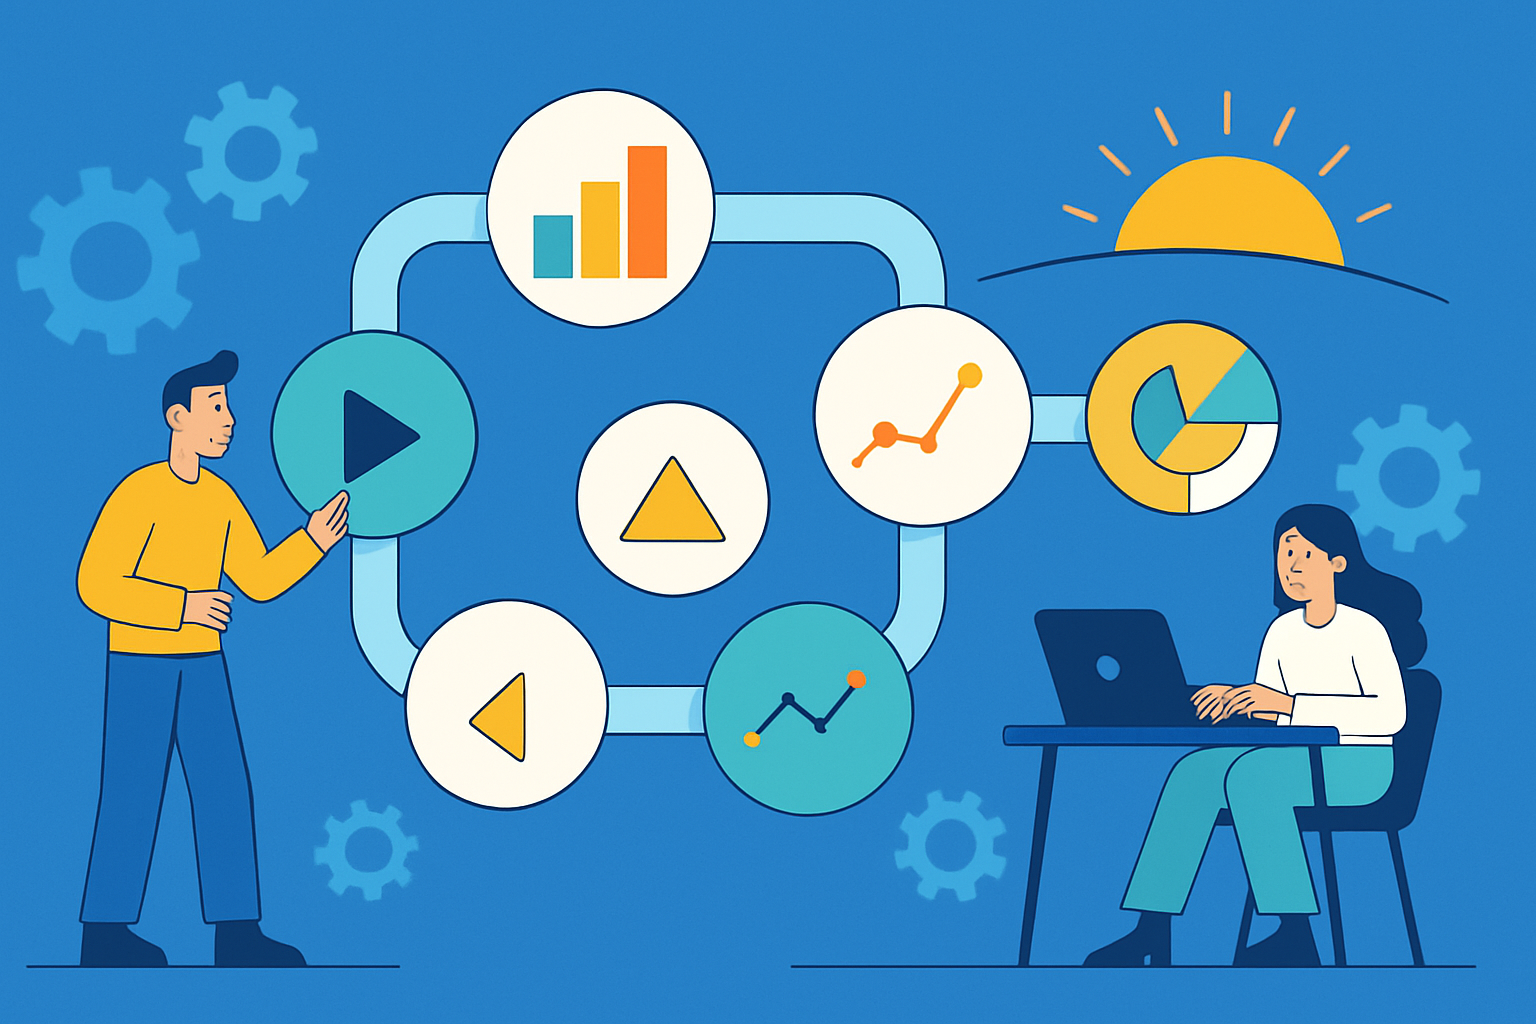
Import once, analyze continuously, and share results with executives and engineering leaders. Select a capability to learn more.






Built for organizations, secured by design
Every tenant is isolated with role-based access, so administrators and viewers see exactly what they should.
- Organization-scoped tenants with Administrator and Viewer roles.
- Developer and team mapping with effective dates for accurate historical attribution.
- Sign in with Microsoft, GitHub, Google, or email — with encrypted credentials at rest.
- Fast, predictable analytics that stay responsive without hammering your Azure or GitHub APIs.
One platform, connected sources
Azure DevOps, GitHub, Cursor, and platform AI work together in a single analytics warehouse — each capability documented in the sections above.
- Source sync imports and keeps code, work items, and CI/CD history current.
- Dashboards and reports share the same filters and date ranges.
- AI assistant, daily insights, and Your Story build on imported analytics.
Simple, transparent pricing
Start free and upgrade when you need unlimited scale and automation.
Free
Everything you need to start measuring engineering activity.
- All dashboard views — executive, teams, repositories, vendors, and pull requests
- AI assistant for natural-language analytics
- Activity heatmaps, work item flow, pipeline, and deployment metrics
- Azure DevOps Pipelines, GitHub Actions, and release deployment import
- Optional Cursor team sync for external IDE AI usage
- Developer and team mapping with role-based access
- Up to 3 repositories
- 90 days of history retention
- Dashboards up to Last 90 days
- Import history: Last 90 days
- 150,000 AI tokens / month
- Exports: HTML, CSV
- Scheduled report subscriptions
- Daily AI insights — automated highlights from your analytics
- Your Story — AI journals, chapters, seasons & chronicles
Professional
Billed per connected organization
Unlimited scale, automation, and your full analytics history.
- All dashboard views — executive, teams, repositories, vendors, and pull requests
- AI assistant for natural-language analytics
- Activity heatmaps, work item flow, pipeline, and deployment metrics
- Azure DevOps Pipelines, GitHub Actions, and release deployment import
- Optional Cursor team sync for external IDE AI usage
- Developer and team mapping with role-based access
- Unlimited repositories
- Full history retention
- Dashboards up to Everything
- Import your full history
- 1,000,000 AI tokens / month
- Exports: HTML, CSV, Excel, PDF
- Scheduled report subscriptions
- Daily AI insights — automated highlights from your analytics
- Your Story — AI journals, chapters, seasons & chronicles
Premium
Most popularBilled per connected organization
Everything in Professional, plus Your Story — narrative engineering journals.
- All dashboard views — executive, teams, repositories, vendors, and pull requests
- AI assistant for natural-language analytics
- Activity heatmaps, work item flow, pipeline, and deployment metrics
- Azure DevOps Pipelines, GitHub Actions, and release deployment import
- Optional Cursor team sync for external IDE AI usage
- Developer and team mapping with role-based access
- Unlimited repositories
- Full history retention
- Dashboards up to Everything
- Import your full history
- 1,000,000 AI tokens / month
- Exports: HTML, CSV, Excel, PDF
- Scheduled report subscriptions
- Daily AI insights — automated highlights from your analytics
- Your Story — AI journals, chapters, seasons & chronicles
Need more AI capacity? Add token packs of 1,000,000 tokens anytime. Plans and limits stay in sync with your subscription automatically.
Ready to see your engineering activity clearly?
Create an organization, connect Azure DevOps or GitHub, optionally link Cursor, and start measuring delivery activity in minutes.