Engineering Analytics
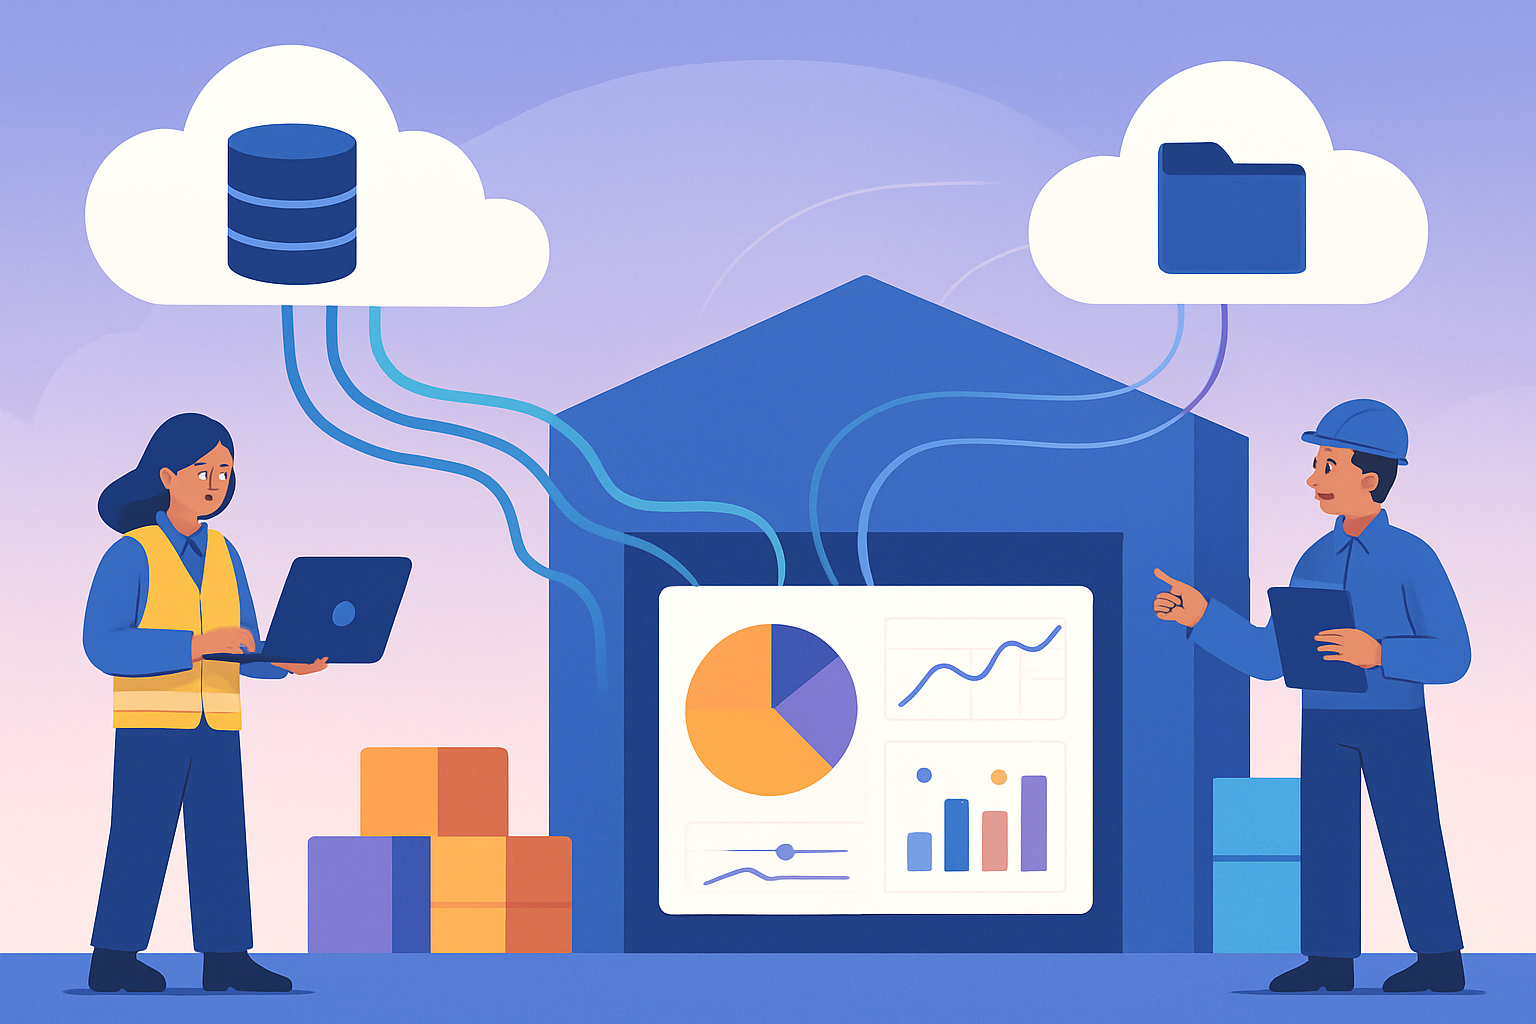
Import commits, pull requests, work items, pipelines, deployments, and IDE AI usage once — then explore leadership dashboards, daily AI insights, Your Story narratives, and scheduled reports without hammering your provider APIs.
Everything you need to measure engineering activity
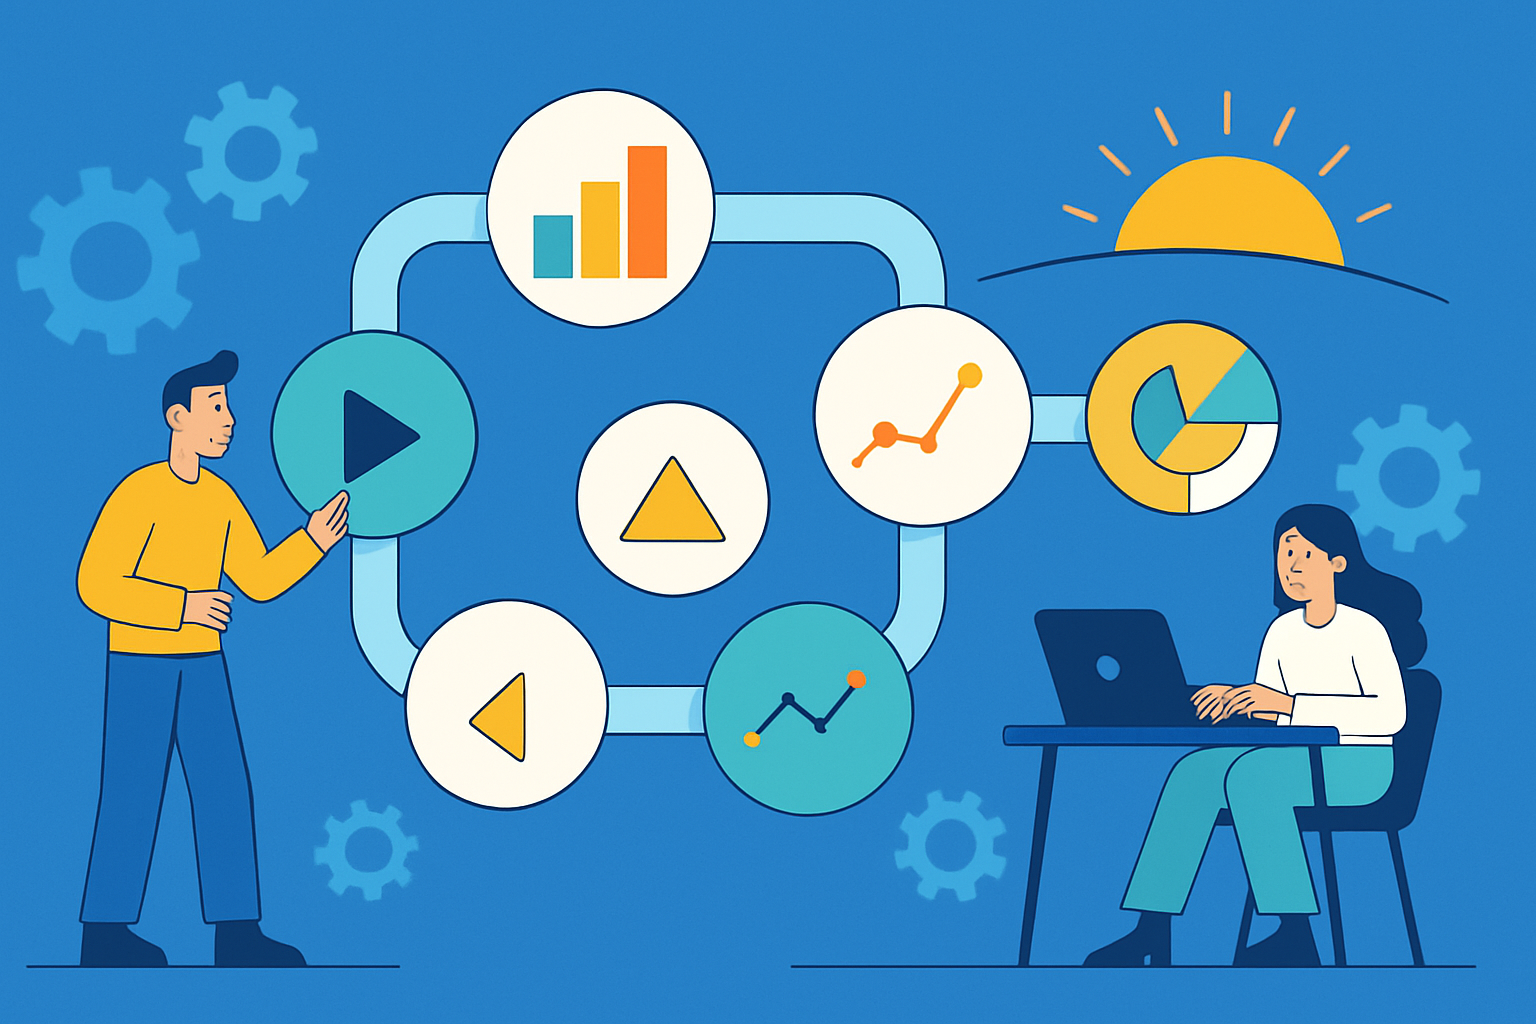
Import once, analyze continuously, and share results with executives and engineering leaders. Select a capability to learn more.






From the blog
Recent notes on delivery visibility and engineering intelligence.




See the platform in action
Real engineering activity from a sample workspace — repositories, projects, teams, and developers are anonymized.
Last 180 days · updated Oct 19, 2026 UTC
Repository activity heatmap
Commit volume across top repositories over the last 365 days.
Weekly activity trends
Commits, pull requests created, and pull requests merged.
Repository share
Top repositories by commits.
Pull request status
Active, completed, abandoned, rejected.
Pipelines & deployments
CI/CD run outcomes, deployment frequency, and delivery gaps from imported pipeline history.
Pipeline runs
CI/CD build and workflow activity.
Run volume
Outcomes
Deployments
Release and environment deployments.
Deployment frequency
By pipeline
Pipeline activity heatmap
Run volume across top pipelines over the last 365 days.
Deployment activity heatmap
Deployment volume across top pipelines over the last 365 days.
Work items
Boards, states, types, and flow metrics from imported work item history.
Work item activity heatmap
Board flow and team handoffs — blue for new items, grayscale for column progress, green for done, team colors for handoffs.
Work item types
Distribution by work item type.
Work item states
Current state mix for changed work items.
Kick-backs by team
Work items reopened after a terminal state.
Ready to see your engineering activity clearly?
Create an organization, connect Azure DevOps or GitHub, optionally link Cursor, and start measuring delivery activity in minutes.